#!/usr/bin/env python3
"""Generate Xenos' reproducible BTCUSDT M15 public baseline evidence package."""

from __future__ import annotations

import csv
import hashlib
import json
import math
import time
import urllib.parse
import urllib.request
from dataclasses import asdict, dataclass
from datetime import datetime, timezone
from pathlib import Path

import matplotlib

matplotlib.use("Agg")
import matplotlib.dates as mdates
import matplotlib.pyplot as plt
import pandas as pd


PROJECT_ROOT = Path(__file__).resolve().parents[1]
OUTPUT_DIR = PROJECT_ROOT / "evidence" / "btcusdt-m15-2026-h1"
DATASET_PATH = OUTPUT_DIR / "candles.csv"
TRADES_PATH = OUTPUT_DIR / "trades.csv"
SUMMARY_PATH = OUTPUT_DIR / "summary.json"
CONFIG_PATH = OUTPUT_DIR / "config.json"
CHART_PATH = OUTPUT_DIR / "equity-curve.png"
README_PATH = OUTPUT_DIR / "README.md"
EVIDENCE_PAGE_PATH = OUTPUT_DIR / "index.html"

SOURCE_ENDPOINT = "https://data-api.binance.vision/api/v3/klines"
SYMBOL = "BTCUSDT"
INTERVAL = "15m"
INTERVAL_MS = 15 * 60 * 1000
START = datetime(2026, 1, 1, tzinfo=timezone.utc)
END_EXCLUSIVE = datetime(2026, 7, 1, tzinfo=timezone.utc)

INITIAL_CAPITAL = 10_000.0
FAST_EMA = 20
SLOW_EMA = 50
FEE_RATE = 0.001
SLIPPAGE_RATE = 0.0002


@dataclass
class Trade:
    trade_id: int
    entry_time_utc: str
    exit_time_utc: str
    entry_price: float
    exit_price: float
    quantity_btc: float
    bars_held: int
    gross_pnl_usdt: float
    fees_usdt: float
    net_pnl_usdt: float
    return_pct: float
    exit_reason: str


def utc_iso_from_ms(value: int) -> str:
    return datetime.fromtimestamp(value / 1000, timezone.utc).isoformat().replace("+00:00", "Z")


def utc_ms(value: datetime) -> int:
    return int(value.timestamp() * 1000)


def fetch_page(start_ms: int, end_ms: int) -> list[list]:
    query = urllib.parse.urlencode(
        {
            "symbol": SYMBOL,
            "interval": INTERVAL,
            "startTime": start_ms,
            "endTime": end_ms,
            "limit": 1000,
        }
    )
    request = urllib.request.Request(
        f"{SOURCE_ENDPOINT}?{query}",
        headers={"User-Agent": "XenosResearchEvidence/1.0"},
    )
    for attempt in range(5):
        try:
            with urllib.request.urlopen(request, timeout=30) as response:
                return json.loads(response.read().decode("utf-8"))
        except Exception:
            if attempt == 4:
                raise
            time.sleep(2**attempt)
    return []


def download_candles() -> pd.DataFrame:
    rows: list[list] = []
    cursor = utc_ms(START)
    end_ms = utc_ms(END_EXCLUSIVE) - 1

    while cursor <= end_ms:
        page = fetch_page(cursor, end_ms)
        if not page:
            break
        rows.extend(page)
        next_cursor = int(page[-1][0]) + INTERVAL_MS
        if next_cursor <= cursor:
            raise RuntimeError("Market-data pagination did not advance.")
        cursor = next_cursor
        time.sleep(0.05)

    columns = [
        "open_time_ms",
        "open",
        "high",
        "low",
        "close",
        "volume",
        "close_time_ms",
        "quote_volume",
        "trade_count",
        "taker_buy_base_volume",
        "taker_buy_quote_volume",
        "unused",
    ]
    frame = pd.DataFrame(rows, columns=columns)
    if frame.empty:
        raise RuntimeError("No candles were returned by the public market-data endpoint.")

    frame = frame.drop(columns=["unused"]).drop_duplicates(subset=["open_time_ms"]).sort_values("open_time_ms")
    frame = frame[
        (frame["open_time_ms"] >= utc_ms(START))
        & (frame["open_time_ms"] < utc_ms(END_EXCLUSIVE))
    ].copy()

    numeric_columns = [
        "open",
        "high",
        "low",
        "close",
        "volume",
        "quote_volume",
        "trade_count",
        "taker_buy_base_volume",
        "taker_buy_quote_volume",
    ]
    for column in numeric_columns:
        frame[column] = pd.to_numeric(frame[column])

    frame["open_time_utc"] = frame["open_time_ms"].map(utc_iso_from_ms)
    frame["close_time_utc"] = frame["close_time_ms"].map(utc_iso_from_ms)
    ordered_columns = [
        "open_time_utc",
        "close_time_utc",
        "open",
        "high",
        "low",
        "close",
        "volume",
        "quote_volume",
        "trade_count",
        "taker_buy_base_volume",
        "taker_buy_quote_volume",
        "open_time_ms",
        "close_time_ms",
    ]
    frame = frame[ordered_columns]
    OUTPUT_DIR.mkdir(parents=True, exist_ok=True)
    frame.to_csv(DATASET_PATH, index=False, float_format="%.8f")
    return frame


def load_or_download_candles() -> pd.DataFrame:
    if not DATASET_PATH.exists():
        return download_candles()
    frame = pd.read_csv(DATASET_PATH)
    for column in ["open", "high", "low", "close", "volume", "quote_volume"]:
        frame[column] = pd.to_numeric(frame[column])
    return frame


def sha256_file(path: Path) -> str:
    digest = hashlib.sha256()
    with path.open("rb") as file_handle:
        for block in iter(lambda: file_handle.read(1024 * 1024), b""):
            digest.update(block)
    return digest.hexdigest()


def run_backtest(frame: pd.DataFrame) -> tuple[list[Trade], pd.DataFrame]:
    data = frame.copy()
    data["ema_fast"] = data["close"].ewm(span=FAST_EMA, adjust=False, min_periods=FAST_EMA).mean()
    data["ema_slow"] = data["close"].ewm(span=SLOW_EMA, adjust=False, min_periods=SLOW_EMA).mean()
    data["long_signal"] = data["ema_fast"] > data["ema_slow"]
    data["cross_up"] = data["long_signal"] & ~data["long_signal"].shift(1, fill_value=False)
    data["cross_down"] = ~data["long_signal"] & data["long_signal"].shift(1, fill_value=False)

    cash = INITIAL_CAPITAL
    quantity = 0.0
    entry: dict | None = None
    trades: list[Trade] = []
    equity_rows: list[dict] = []

    for index in range(1, len(data)):
        row = data.iloc[index]
        prior = data.iloc[index - 1]

        if quantity > 0 and bool(prior["cross_down"]):
            fill_price = float(row["open"]) * (1 - SLIPPAGE_RATE)
            proceeds = quantity * fill_price
            exit_fee = proceeds * FEE_RATE
            cash = proceeds - exit_fee
            entry_cost = entry["notional"] + entry["fee"]
            gross_pnl = proceeds - entry["notional"]
            fees = entry["fee"] + exit_fee
            net_pnl = cash - entry_cost
            trades.append(
                Trade(
                    trade_id=len(trades) + 1,
                    entry_time_utc=entry["time"],
                    exit_time_utc=row["open_time_utc"],
                    entry_price=entry["price"],
                    exit_price=fill_price,
                    quantity_btc=quantity,
                    bars_held=index - entry["index"],
                    gross_pnl_usdt=gross_pnl,
                    fees_usdt=fees,
                    net_pnl_usdt=net_pnl,
                    return_pct=(net_pnl / entry_cost) * 100,
                    exit_reason="EMA 20 crossed below EMA 50",
                )
            )
            quantity = 0.0
            entry = None

        if quantity == 0 and bool(prior["cross_up"]) and not math.isnan(float(prior["ema_slow"])):
            fill_price = float(row["open"]) * (1 + SLIPPAGE_RATE)
            quantity = cash / (fill_price * (1 + FEE_RATE))
            notional = quantity * fill_price
            entry_fee = notional * FEE_RATE
            cash = max(0.0, cash - notional - entry_fee)
            entry = {
                "index": index,
                "time": row["open_time_utc"],
                "price": fill_price,
                "notional": notional,
                "fee": entry_fee,
            }

        if quantity > 0:
            liquidation_price = float(row["close"]) * (1 - SLIPPAGE_RATE)
            liquidation_value = quantity * liquidation_price * (1 - FEE_RATE)
            equity = cash + liquidation_value
        else:
            equity = cash
        equity_rows.append({"time_utc": row["close_time_utc"], "equity_usdt": equity})

    if quantity > 0 and entry is not None:
        last = data.iloc[-1]
        fill_price = float(last["close"]) * (1 - SLIPPAGE_RATE)
        proceeds = quantity * fill_price
        exit_fee = proceeds * FEE_RATE
        cash = proceeds - exit_fee
        entry_cost = entry["notional"] + entry["fee"]
        gross_pnl = proceeds - entry["notional"]
        fees = entry["fee"] + exit_fee
        net_pnl = cash - entry_cost
        trades.append(
            Trade(
                trade_id=len(trades) + 1,
                entry_time_utc=entry["time"],
                exit_time_utc=last["close_time_utc"],
                entry_price=entry["price"],
                exit_price=fill_price,
                quantity_btc=quantity,
                bars_held=(len(data) - 1) - entry["index"],
                gross_pnl_usdt=gross_pnl,
                fees_usdt=fees,
                net_pnl_usdt=net_pnl,
                return_pct=(net_pnl / entry_cost) * 100,
                exit_reason="End of dataset",
            )
        )
        equity_rows[-1]["equity_usdt"] = cash

    equity_frame = pd.DataFrame(equity_rows)
    equity_frame["time_utc"] = pd.to_datetime(equity_frame["time_utc"], utc=True)
    equity_frame["peak"] = equity_frame["equity_usdt"].cummax()
    equity_frame["drawdown_pct"] = (equity_frame["equity_usdt"] / equity_frame["peak"] - 1) * 100
    return trades, equity_frame


def round_trade(trade: Trade) -> dict:
    row = asdict(trade)
    for key in [
        "entry_price",
        "exit_price",
        "quantity_btc",
        "gross_pnl_usdt",
        "fees_usdt",
        "net_pnl_usdt",
        "return_pct",
    ]:
        row[key] = round(row[key], 8 if key == "quantity_btc" else 4)
    return row


def build_summary(frame: pd.DataFrame, trades: list[Trade], equity: pd.DataFrame) -> dict:
    net_results = [trade.net_pnl_usdt for trade in trades]
    wins = [value for value in net_results if value > 0]
    losses = [value for value in net_results if value < 0]
    gross_profit = sum(wins)
    gross_loss = abs(sum(losses))
    final_equity = float(equity.iloc[-1]["equity_usdt"])
    expected_candles = int((END_EXCLUSIVE - START).total_seconds() / (15 * 60))
    open_times = pd.to_numeric(frame["open_time_ms"]).astype("int64")
    gaps = int((open_times.diff().dropna() != INTERVAL_MS).sum())

    return {
        "evidence_version": "1.0",
        "experiment_id": "xenos-btcusdt-m15-ema20-50-2026h1-v1",
        "experiment_date_utc": datetime.now(timezone.utc).date().isoformat(),
        "symbol": SYMBOL,
        "timeframe": "M15",
        "dataset_start_utc": START.isoformat().replace("+00:00", "Z"),
        "dataset_end_utc": (END_EXCLUSIVE - pd.Timedelta(milliseconds=1)).isoformat().replace("+00:00", "Z"),
        "data_source": "Binance public Spot market-data REST API",
        "source_endpoint": SOURCE_ENDPOINT,
        "dataset_rows": int(len(frame)),
        "expected_candles": expected_candles,
        "detected_interval_gaps": gaps,
        "dataset_sha256": sha256_file(DATASET_PATH),
        "strategy": "Long-only EMA 20/50 crossover baseline",
        "execution": "Signal on candle close; simulated execution at next candle open",
        "initial_capital_usdt": round(INITIAL_CAPITAL, 2),
        "final_equity_usdt": round(final_equity, 2),
        "total_return_pct": round((final_equity / INITIAL_CAPITAL - 1) * 100, 2),
        "number_of_trades": len(trades),
        "winning_trades": len(wins),
        "losing_trades": len(losses),
        "win_rate_pct": round((len(wins) / len(trades) * 100) if trades else 0, 2),
        "profit_factor": round((gross_profit / gross_loss) if gross_loss else 0, 2),
        "maximum_drawdown_pct": round(abs(float(equity["drawdown_pct"].min())), 2),
        "total_fees_usdt": round(sum(trade.fees_usdt for trade in trades), 2),
        "fee_per_side_pct": FEE_RATE * 100,
        "slippage_per_side_pct": SLIPPAGE_RATE * 100,
        "leverage": "None",
        "position_model": "100% of available simulated equity per long entry",
        "result_type": "Simulated historical research result",
        "limitations": [
            "No live orders were placed.",
            "The model uses candle data and does not model intrabar order-book liquidity.",
            "Fixed slippage and fee assumptions may differ from real execution.",
            "The baseline was not selected as an investment recommendation.",
            "Past or simulated performance does not predict future results.",
        ],
    }


def write_trades(trades: list[Trade]) -> None:
    rows = [round_trade(trade) for trade in trades]
    if not rows:
        raise RuntimeError("The baseline generated no completed trades.")
    with TRADES_PATH.open("w", newline="", encoding="utf-8") as file_handle:
        writer = csv.DictWriter(file_handle, fieldnames=rows[0].keys())
        writer.writeheader()
        writer.writerows(rows)


def write_config() -> None:
    config = {
        "experiment_id": "xenos-btcusdt-m15-ema20-50-2026h1-v1",
        "symbol": SYMBOL,
        "timeframe": INTERVAL,
        "dataset_start_utc": START.isoformat().replace("+00:00", "Z"),
        "dataset_end_exclusive_utc": END_EXCLUSIVE.isoformat().replace("+00:00", "Z"),
        "strategy": {
            "type": "long_only_ema_crossover_baseline",
            "fast_ema_period": FAST_EMA,
            "slow_ema_period": SLOW_EMA,
            "entry_rule": "EMA 20 crosses above EMA 50",
            "exit_rule": "EMA 20 crosses below EMA 50",
        },
        "execution": {
            "signal_timing": "candle close",
            "fill_timing": "next candle open",
            "initial_capital_usdt": INITIAL_CAPITAL,
            "capital_allocation_pct": 100,
            "fee_per_side_pct": FEE_RATE * 100,
            "slippage_per_side_pct": SLIPPAGE_RATE * 100,
            "leverage": 0,
            "short_selling": False,
        },
    }
    CONFIG_PATH.write_text(json.dumps(config, indent=2) + "\n", encoding="utf-8")


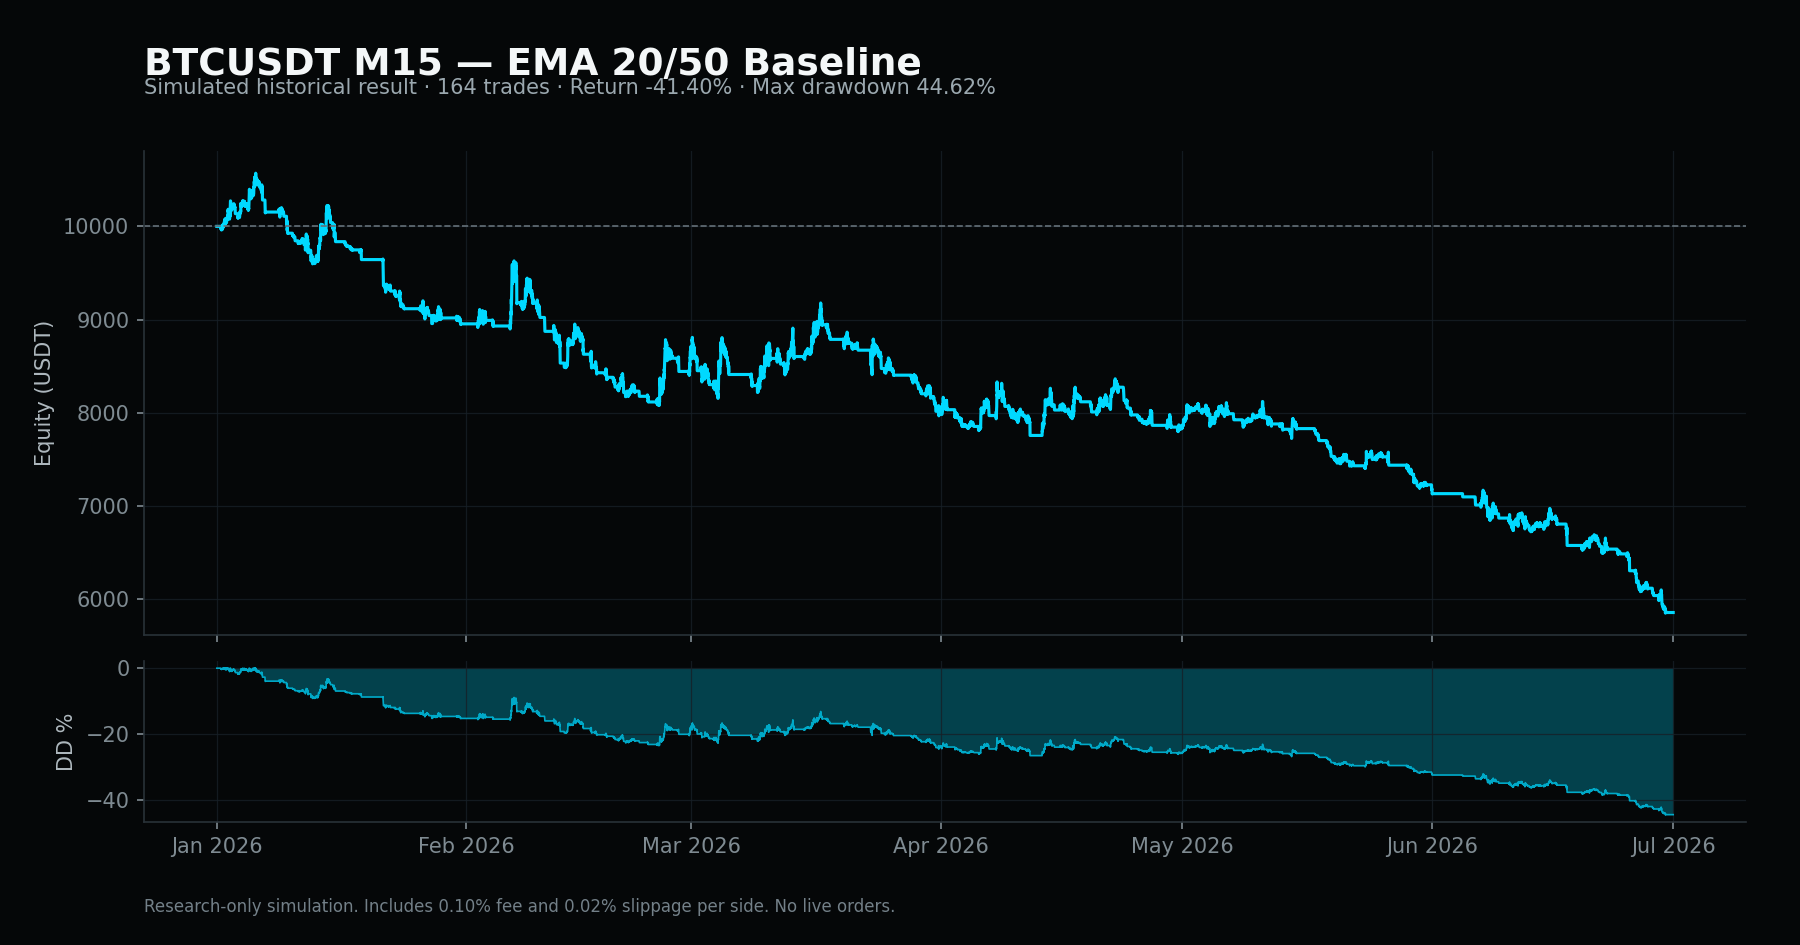
def write_chart(summary: dict, equity: pd.DataFrame) -> None:
    plt.rcParams.update(
        {
            "figure.facecolor": "#050708",
            "axes.facecolor": "#050708",
            "axes.edgecolor": "#293238",
            "axes.labelcolor": "#aeb8be",
            "xtick.color": "#7f8b92",
            "ytick.color": "#7f8b92",
            "text.color": "#f4f7f8",
            "font.family": "DejaVu Sans",
        }
    )
    figure, (equity_axis, drawdown_axis) = plt.subplots(
        2,
        1,
        figsize=(12, 6.3),
        dpi=150,
        sharex=True,
        gridspec_kw={"height_ratios": [3, 1], "hspace": 0.08},
    )
    figure.subplots_adjust(left=0.08, right=0.97, top=0.84, bottom=0.13)
    figure.suptitle(
        "BTCUSDT M15 — EMA 20/50 Baseline",
        x=0.08,
        y=0.95,
        ha="left",
        fontsize=18,
        fontweight="bold",
    )
    figure.text(
        0.08,
        0.90,
        (
            f"Simulated historical result · {summary['number_of_trades']} trades · "
            f"Return {summary['total_return_pct']:.2f}% · Max drawdown {summary['maximum_drawdown_pct']:.2f}%"
        ),
        color="#9ba8af",
        fontsize=10,
    )

    equity_axis.plot(equity["time_utc"], equity["equity_usdt"], color="#00d9ff", linewidth=1.5)
    equity_axis.axhline(INITIAL_CAPITAL, color="#647078", linewidth=0.8, linestyle="--")
    equity_axis.set_ylabel("Equity (USDT)")
    equity_axis.grid(True, color="#172027", linewidth=0.6, alpha=0.8)
    equity_axis.spines["top"].set_visible(False)
    equity_axis.spines["right"].set_visible(False)

    drawdown_axis.fill_between(
        equity["time_utc"],
        equity["drawdown_pct"],
        0,
        color="#00d9ff",
        alpha=0.28,
        linewidth=0,
    )
    drawdown_axis.plot(equity["time_utc"], equity["drawdown_pct"], color="#00a9c8", linewidth=0.8)
    drawdown_axis.set_ylabel("DD %")
    drawdown_axis.grid(True, color="#172027", linewidth=0.6, alpha=0.8)
    drawdown_axis.spines["top"].set_visible(False)
    drawdown_axis.spines["right"].set_visible(False)
    drawdown_axis.xaxis.set_major_locator(mdates.MonthLocator())
    drawdown_axis.xaxis.set_major_formatter(mdates.DateFormatter("%b %Y"))

    figure.text(
        0.08,
        0.035,
        "Research-only simulation. Includes 0.10% fee and 0.02% slippage per side. No live orders.",
        color="#738088",
        fontsize=8,
    )
    figure.savefig(CHART_PATH, facecolor=figure.get_facecolor())
    plt.close(figure)


def format_money(value: float) -> str:
    return f"${value:,.2f}"


def write_readme(summary: dict) -> None:
    text = f"""# Xenos reproducible baseline evidence

Experiment: `{summary['experiment_id']}`

- Symbol: {summary['symbol']}
- Timeframe: {summary['timeframe']}
- Dataset: {summary['dataset_start_utc']} through {summary['dataset_end_utc']}
- Source: {summary['data_source']} (`{summary['source_endpoint']}`)
- Candles: {summary['dataset_rows']:,}
- Dataset SHA-256: `{summary['dataset_sha256']}`
- Strategy: {summary['strategy']}
- Initial simulated capital: {format_money(summary['initial_capital_usdt'])}
- Completed trades: {summary['number_of_trades']}
- Total return: {summary['total_return_pct']:.2f}%
- Win rate: {summary['win_rate_pct']:.2f}%
- Profit factor: {summary['profit_factor']:.2f}
- Maximum drawdown: {summary['maximum_drawdown_pct']:.2f}%

## Reproduce

From the project root:

```powershell
python research\\run_public_baseline.py
```

The script reuses `candles.csv` when it exists. Delete that file only if you intentionally
want to download the dataset again from the recorded public source.

## Important limitation

This is a simulated historical research baseline, not live trading performance, financial
advice, or a promise of future returns. It uses next-candle-open execution, a fixed 0.10%
fee per side and fixed 0.02% slippage per side. It does not model order-book liquidity.
"""
    README_PATH.write_text(text, encoding="utf-8")


def write_evidence_page(summary: dict, trades: list[Trade]) -> None:
    rows = "\n".join(
        f"""<tr>
          <td>{trade.trade_id}</td>
          <td>{trade.entry_time_utc}</td>
          <td>{trade.exit_time_utc}</td>
          <td>{trade.entry_price:,.2f}</td>
          <td>{trade.exit_price:,.2f}</td>
          <td class="{'positive' if trade.net_pnl_usdt >= 0 else 'negative'}">{trade.net_pnl_usdt:,.2f}</td>
          <td>{trade.return_pct:.2f}%</td>
        </tr>"""
        for trade in trades
    )
    html = f"""<!doctype html>
<html lang="en">
<head>
  <meta charset="utf-8">
  <meta name="viewport" content="width=device-width, initial-scale=1">
  <title>BTCUSDT M15 Research Validation Report | Xenos</title>
  <meta name="description" content="A reproducible Xenos historical backtest validation report with methodology, dataset provenance, full results and downloadable research artifacts.">
  <meta name="robots" content="index, follow">
  <link rel="canonical" href="https://www.xenos.sbs/evidence/btcusdt-m15-2026-h1/">
  <meta property="og:type" content="article">
  <meta property="og:title" content="BTCUSDT M15 Research Validation Report | Xenos">
  <meta property="og:description" content="Transparent historical research: validated data-to-report pipeline, rejected strategy result and public reproduction artifacts.">
  <meta property="og:url" content="https://www.xenos.sbs/evidence/btcusdt-m15-2026-h1/">
  <meta property="og:image" content="https://www.xenos.sbs/assets/og-xenos.png">
  <style>
    :root {{ color-scheme:dark; --bg:#050708; --panel:#0b0f11; --panel-soft:#0e1417; --text:#eef3f5; --muted:#93a0a7; --line:#202a30; --cyan:#00d9ff; --green:#63d9ad; --red:#ff8d8d; }}
    * {{ box-sizing:border-box; }} body {{ margin:0; background:var(--bg); color:var(--text); font:16px/1.6 Arial,sans-serif; }}
    header,main,footer {{ width:min(1120px,calc(100% - 32px)); margin:auto; }} header {{ padding:28px 0; display:flex; justify-content:space-between; border-bottom:1px solid var(--line); }}
    a {{ color:var(--cyan); }} .brand {{ color:#fff; font-size:22px; font-style:italic; text-decoration:none; }} main {{ padding:64px 0; }}
    .eyebrow,.section-label {{ color:var(--cyan); text-transform:uppercase; letter-spacing:.14em; font-size:12px; font-weight:700; }} h1 {{ max-width:900px; font-size:clamp(38px,7vw,72px); line-height:1; margin:12px 0 20px; }}
    h2 {{ margin-top:0; }} .lead {{ max-width:850px; color:var(--muted); font-size:18px; }} .notice {{ margin:28px 0; padding:18px 20px; border:1px solid #704143; background:#1a0d0e; color:#f0bbbb; border-radius:12px; }}
    .status-grid {{ display:grid; grid-template-columns:repeat(3,1fr); gap:12px; margin:32px 0 20px; }}
    .status-card {{ position:relative; overflow:hidden; min-height:145px; padding:20px; background:var(--panel-soft); border:1px solid var(--line); border-radius:14px; }}
    .status-card::before {{ content:""; position:absolute; inset:0 auto 0 0; width:3px; background:var(--cyan); }} .status-card.rejected::before {{ background:var(--red); }} .status-card.neutral::before {{ background:#718089; }}
    .status-card span {{ display:block; color:var(--muted); font-size:11px; font-weight:700; text-transform:uppercase; letter-spacing:.1em; }}
    .status-card strong {{ display:block; margin:8px 0 4px; font-size:25px; }} .status-card.validated strong {{ color:var(--green); }} .status-card.rejected strong {{ color:var(--red); }}
    .status-card small {{ color:var(--muted); font-size:13px; }}
    .metrics {{ display:grid; grid-template-columns:repeat(auto-fit,minmax(160px,1fr)); gap:12px; margin:32px 0; }} .metric,.panel {{ background:var(--panel); border:1px solid var(--line); border-radius:14px; }}
    .metric {{ padding:18px; }} .metric strong {{ display:block; font-size:24px; }} .metric span {{ color:var(--muted); font-size:12px; text-transform:uppercase; letter-spacing:.08em; }}
    .panel {{ padding:clamp(20px,4vw,32px); margin:18px 0; }} .panel > p:not(.section-label) {{ color:var(--muted); max-width:850px; }} .chart {{ width:100%; height:auto; border-radius:10px; border:1px solid var(--line); }}
    .checklist {{ display:grid; grid-template-columns:repeat(2,1fr); gap:10px 24px; padding:0; list-style:none; }} .checklist li {{ position:relative; padding:10px 0 10px 28px; border-bottom:1px solid var(--line); }} .checklist li::before {{ content:"✓"; position:absolute; left:0; color:var(--green); font-weight:700; }}
    .assessment {{ display:grid; grid-template-columns:repeat(3,1fr); gap:12px; margin-top:22px; }} .assessment div {{ padding:16px; background:var(--panel-soft); border:1px solid var(--line); border-radius:10px; }} .assessment strong {{ display:block; margin-bottom:4px; }} .assessment span {{ color:var(--muted); font-size:13px; }}
    dl {{ display:grid; grid-template-columns:minmax(150px,240px) 1fr; gap:8px 18px; }} dt {{ color:var(--muted); }} dd {{ margin:0; overflow-wrap:anywhere; }}
    .downloads {{ display:flex; flex-wrap:wrap; gap:10px; }} .downloads a {{ border:1px solid var(--line); border-radius:999px; padding:8px 14px; text-decoration:none; }}
    .table-wrap {{ overflow:auto; }} table {{ width:100%; border-collapse:collapse; font-size:13px; }} th,td {{ padding:10px; text-align:left; border-bottom:1px solid var(--line); white-space:nowrap; }}
    th {{ color:var(--muted); }} .positive {{ color:var(--green); }} .negative {{ color:var(--red); }} footer {{ color:var(--muted); padding:30px 0 60px; border-top:1px solid var(--line); }}
    @media(max-width:760px) {{ .status-grid,.assessment,.checklist {{ grid-template-columns:1fr; }} dl {{ grid-template-columns:1fr; }} dd {{ margin-bottom:10px; }} }}
  </style>
</head>
<body>
  <header><a class="brand" href="/">XENOS</a><a href="/">Back to website</a></header>
  <main>
    <p class="eyebrow">Research validation report · {summary['experiment_id']}</p>
    <h1>Historical backtest validation report</h1>
    <p class="lead">This experiment validates the Xenos data-to-report research workflow using a deliberately simple BTCUSDT M15 baseline. Its purpose is operational verification—not a claim that the strategy is profitable or ready for live use.</p>

    <section class="status-grid" aria-label="Validation status">
      <div class="status-card validated"><span>Pipeline status</span><strong>Validated</strong><small>Data-to-report workflow completed</small></div>
      <div class="status-card rejected"><span>Strategy decision</span><strong>Rejected</strong><small>Not approved for beta or live use</small></div>
      <div class="status-card neutral"><span>Result type</span><strong>Simulated</strong><small>No live orders or capital involved</small></div>
    </section>

    <div class="notice"><strong>Research decision:</strong> do not advance this EMA 20/50 configuration. It failed performance review and remains published in full to demonstrate transparent failure reporting and reproducibility.</div>

    <section class="metrics" aria-label="Operational validation metrics">
      <div class="metric"><strong>{summary['dataset_rows']:,}</strong><span>Candles processed</span></div>
      <div class="metric"><strong>{summary['number_of_trades']}</strong><span>Trades recorded</span></div>
      <div class="metric"><strong>{summary['detected_interval_gaps']}</strong><span>Detected gaps</span></div>
      <div class="metric"><strong>Verified</strong><span>Dataset hash</span></div>
      <div class="metric"><strong>Modelled</strong><span>Fees + slippage</span></div>
      <div class="metric"><strong>Public</strong><span>Research artifacts</span></div>
    </section>

    <section class="panel">
      <p class="section-label">Validation objective</p>
      <h2>What this experiment demonstrates</h2>
      <p>A complete, inspectable research run from source data to a published decision. Successful pipeline execution does not imply successful strategy performance.</p>
      <ul class="checklist">
        <li>Ingest and version public market data</li>
        <li>Detect missing 15-minute intervals</li>
        <li>Generate signals from closed candles only</li>
        <li>Execute simulated fills on the next bar</li>
        <li>Apply explicit fees and slippage</li>
        <li>Publish trades, metrics, code and dataset hash</li>
      </ul>
    </section>

    <section class="panel">
      <p class="section-label">Methodology and provenance</p>
      <h2>Experiment configuration and provenance</h2>
      <dl>
        <dt>Dataset period</dt><dd>{summary['dataset_start_utc']} to {summary['dataset_end_utc']}</dd>
        <dt>Experiment date</dt><dd>{summary['experiment_date_utc']} UTC</dd>
        <dt>Market data</dt><dd>{summary['data_source']}</dd>
        <dt>Candles</dt><dd>{summary['dataset_rows']:,} rows; {summary['detected_interval_gaps']} detected interval gaps</dd>
        <dt>Dataset SHA-256</dt><dd><code>{summary['dataset_sha256']}</code></dd>
        <dt>Strategy</dt><dd>{summary['strategy']}</dd>
        <dt>Execution</dt><dd>{summary['execution']}</dd>
        <dt>Costs</dt><dd>{summary['fee_per_side_pct']:.2f}% fee and {summary['slippage_per_side_pct']:.2f}% slippage per side</dd>
        <dt>Initial capital</dt><dd>{format_money(summary['initial_capital_usdt'])} simulated</dd>
        <dt>Position model</dt><dd>{summary['position_model']}</dd>
        <dt>Total modelled fees</dt><dd>{format_money(summary['total_fees_usdt'])}</dd>
        <dt>Leverage</dt><dd>{summary['leverage']}</dd>
      </dl>
    </section>

    <section class="panel">
      <p class="section-label">Full result disclosure</p>
      <h2>Equity curve and drawdown</h2>
      <p>The chart and metrics below show the actual result of the rejected baseline. Negative outcomes are retained rather than filtered from the evidence record.</p>
      <img class="chart" src="equity-curve.png" width="1800" height="945" alt="Equity curve and drawdown for the rejected BTCUSDT M15 simulated baseline">
      <div class="metrics" aria-label="Backtest performance metrics">
        <div class="metric"><strong>{summary['number_of_trades']}</strong><span>Completed trades</span></div>
        <div class="metric"><strong>{summary['win_rate_pct']:.2f}%</strong><span>Win rate</span></div>
        <div class="metric"><strong>{summary['profit_factor']:.2f}</strong><span>Profit factor</span></div>
        <div class="metric"><strong>{summary['maximum_drawdown_pct']:.2f}%</strong><span>Maximum drawdown</span></div>
        <div class="metric"><strong>{summary['total_return_pct']:.2f}%</strong><span>Total return</span></div>
        <div class="metric"><strong>{format_money(summary['final_equity_usdt'])}</strong><span>Final simulated equity</span></div>
      </div>
      <div class="assessment">
        <div><strong class="negative">Decision: rejected</strong><span>Not suitable for beta inclusion or live deployment.</span></div>
        <div><strong>Why</strong><span>Negative return, profit factor below 1.0 and substantial drawdown.</span></div>
        <div><strong>Interpretation</strong><span>The research pipeline operated as intended; this configuration did not.</span></div>
      </div>
    </section>

    <section class="panel">
      <p class="section-label">Independent inspection</p>
      <h2>Download and reproduce</h2>
      <p>These artifacts are published so the result can be inspected rather than accepted as a marketing claim.</p>
      <div class="downloads">
        <a href="summary.json">Summary JSON</a>
        <a href="config.json">Configuration JSON</a>
        <a href="trades.csv">Completed trades CSV</a>
        <a href="candles.csv">Source candles CSV</a>
        <a href="run_public_baseline.py">Reproduction script</a>
        <a href="README.md">Method notes</a>
      </div>
    </section>

    <section class="panel">
      <p class="section-label">Audit trail</p>
      <h2>Completed trades</h2>
      <div class="table-wrap">
        <table>
          <thead><tr><th>#</th><th>Entry UTC</th><th>Exit UTC</th><th>Entry</th><th>Exit</th><th>Net P&amp;L (USDT)</th><th>Return</th></tr></thead>
          <tbody>{rows}</tbody>
        </table>
      </div>
    </section>

    <section class="panel">
      <p class="section-label">Scope</p>
      <h2>Limitations</h2>
      <ul>{''.join(f'<li>{item}</li>' for item in summary['limitations'])}</ul>
    </section>
  </main>
  <footer>Generated by the Xenos reproducible research baseline. Research and paper-trading use only.</footer>
</body>
</html>
"""
    EVIDENCE_PAGE_PATH.write_text(html, encoding="utf-8")


def main() -> None:
    OUTPUT_DIR.mkdir(parents=True, exist_ok=True)
    candles = load_or_download_candles()
    trades, equity = run_backtest(candles)
    write_trades(trades)
    write_config()
    summary = build_summary(candles, trades, equity)
    SUMMARY_PATH.write_text(json.dumps(summary, indent=2) + "\n", encoding="utf-8")
    write_chart(summary, equity)
    write_readme(summary)
    write_evidence_page(summary, trades)
    (OUTPUT_DIR / "run_public_baseline.py").write_text(
        Path(__file__).read_text(encoding="utf-8"),
        encoding="utf-8",
    )
    print(json.dumps(summary, indent=2))


if __name__ == "__main__":
    main()